Which of the following relationships represents a positive correlation between two variables?
A. As a student’s class attendance decreases, the student’s overall grade remains the same
B. As the number of hours a person exercises decreases, the weight of that person increases
C. As the number of miles driven increases, the amount of the gasoline in the tank decreases
D. As the amount of water plant receives increases, the growth rate of the plant increase.
Correlation of two variables falls into:
Positive correlation: an increase in one variable causes another variable to increase
Negative correlation: an increase in one variable causes another one to decrease
No correlation: a change in one variable does not cause any response in another variable.
From the given choices
Option a is no correlation
Option b is a negative correlation
Option c is a negative correlation
Option d is a positive correlation
Therefore, the Correct Answer is D.
More Questions on TEAS 7 Math
-
Q #1: How many feet are in 6 yards?
A. 9ft
B. 18 ft
C. 36 ft
D. 2 ft
Answer Explanation
here we use the US customary system to convert between yards and feet. We use the conversion 1 yard =3 feet. Then, 6 yards to ft is found as
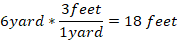
Thus, 6 yards is equal to 18 ft.
-
Q #2: A student performs the following estimations. 24+190≈210 151+319≈470 974+1022≈1990 Based on these estimations, which of the following is the student’s estimate of 452+5017?
A. 5470
B. 5500
C. 5400
D. 5450
Answer Explanation
from the given estimations, we can find the actual addition of the numbers and see a trend the student utilizes to find their estimates. The exact sum is as follows
24+190=214
151+319=470
974+1022=1996
From the above evaluation, we can clearly see the students approximates the value in the ones values. So, in the problem we need to approximate 452+5017.
452+5017=5469
We can approximate 5469 based on the provided choices to 5470.
-
Q #3: The graph below represents the amount of rainfall in a particular state by month. Which of the following is the total rainfall for the first 3 months of the year?
A. 4 inches
B. 5 inches
C. 4.5 inches
D. 3.5 inches
Answer Explanation
The first three months of the year are January, February, and March. We need to find the total rainfall for these three months from the provided graph.
In the month of January, rainfall is between o and 1, which is halfway. Therefore, rainfall in January is 0.5 inches
On February, rainfall was 1 inch and on March the rainfall was 2 inches. Thus,
Total rainfall = 0.5 inches + 1 inches + 2 inches = 3.5 inches

