Which of the following relationships represents a negative correlation between two variables?
A. As a student’s class attendance decreases, the student’s overall grade remains the same
B. As the number of hours a person exercises decreases, the weight of that person remains unchanged
C. As the number of miles driven increases, the amount of the gasoline in the tank decreases
D. As the amount of water plant receives increases, the growth rate of the plant increase.
Correlation of two variables falls into:
Positive correlation: an increase in one variable causes another variable to increase
Negative correlation: an increase in one variable causes another one to decrease
No correlation: a change in one variable does not cause any response in another variable.
From the given choices
Option a is no correlation
Option b is a no correlation
Option c is a negative correlation
Option d is a positive correlation
Therefore, the Correct Answer is C.
More Questions on TEAS 7 Math
-
Q #1: Twelve less than thrice a number Which of the following translates the phrase above into a mathematical expression?
A. 3x - 12
B. 12 - 3x
C. 12x - 2
D. 3x + 12
Answer Explanation
We need to form a mathematical expression from the given word problem.
Let the unknown number be x.
Thrice a number is three times = 3x
Twelve less than thrice a number = 3x-12
Thus, the mathematical expression from the word problem is 3x-12
-
Q #2: If a box of 45 syringes costs $720.00, which of the following is the cost of five syringes?
A. $75.00
B. $66.00
C. $82.00
D. $80.00
Answer Explanation
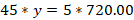
From the cost of 45 syringes, we are required to find the cost of 5 syringes. We set up a proportion equation by letting the cost of 5 syringes to y. Besides, we let the cost to be numerator and number of syringes to be denominator as follows.

Solve the value of y by cross products
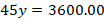
Divide both sides by 45
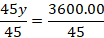

Therefore, 5 syringes will cost $80.00.
-
Q #3: A math teacher obtained the following scores from a class of 45 students. Which of the following is the best way to display the frequency of each day of the week? Test score 50-59 60-69 70-79 80-89 90-99 Number of students 10 4 9 20 2
A. Scatterplot
B. Pie graph
C. Line graph
D. Histogram
Answer Explanation
In order for the teacher to better visualize the test performance for his class, he needs to present the mark distribution in chart form. A better chart visualizer is the histogram, which will show the frequency of marks against range of test scores. A bar graph will not be used because the rectangles need to touch one another.
In a bar graph, the rectangles do not touch each other. Therefore, it will not be a good chart visualizer.

