Which of the following is the median of the date set below? 5, -3, 10, -2, 0
A. 5
B. 2
C. 10
D. 0
To find the median, we arrange the following numbers in data set from the smallest to the largest as follows.
-3, -2, 0, 5, 10
From the above the data set, the median falls in the third position. Thus, 0 is the median for the given data set.
Therefore, the Correct Answer is D.
More Questions on TEAS 7 Math
-
Q #1: Which of the following values is the greatest?
A. 9/2
B. 4.25
C. 10/3
D. 4.4
Answer Explanation
To find the greatest number from the given options, we first convert the decimal numbers into fractions.
4.25 becomes 425/100
4.4 becomes 44/10
Then, we find the LCM for the denominators of the given fractions. The LCM of 2, 100, 3 and 10 is 300. Now we can multiply each fraction with the LCM.
9/2*300=1350
425/100*300=1275
10/3*300=1000
44/10*300=1320
Comparing the obtained values from above, 1350 is the greatest followed by 1320, 12750, and 1000 in that order. The fraction 9/2 gave a value of 1350, which was the greatest value. Thus, 9/2 is the greatest value from the given option.
You can also convert to decimals and compare which would give you the same answer.
-
Q #2: A recipe calls for 2.5 teaspoons of vanilla. 1 teaspoon equals approximately 4.93 mL. Which of the following is the correct amount of vanilla in mL?
A. 5.33 mL
B. 0.507 mL
C. 7.43 mL
D. 12.325 mL
Answer Explanation
We let x represent the amount of vanilla in mL, since this is what the question is asking us to find.
Next, we will set up a proportion with number of teaspoons on the numerator and amount in mL in the denominator.

Cross-multiply to find the value of x
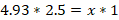

A recipe of 2.5 teaspoons equals 12.325 mL.
-
Q #3: There are 800 students enrolled in four allied health program at a local community college. The percent students in each program is displayed in the pie chart. Which of the following is the number of students enrolled in the respiratory care program?
A. 168
B. 144
C. 336
D. 152
Answer Explanation
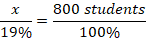
We are asked to find the number of students enrolled in the respiratory care program using the percentages in the pie chart.
If we let x represent the number of students enrolled in the respiratory care program, we can set a proportion equation with number of students on the numerator and percentages on the denominator. The whole pie chart represents 100%, which is 800 students. Then, 19% will represent
We solve the value of x by cross-multiplying the equation above.
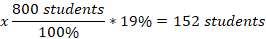
So, 152 students will enroll for a respiratory care program.

