The table below shows the student’s score at the end of the semester. Which of the following would best display the data? Subject Math Chemistry Biology Physics English Test scores 90 72 85 95 63
A. Stem and leaf plot
B. Line graph
C. Bar graph
D. Scatter plot
The best way to visualize the student’s score for each subject is to plot them using a bar graph.
Therefore, the Correct Answer is C.
More Questions on TEAS 7 Math
-
Q #1: The scatter plot below shows the relationship between the student’s exam scores and the students’ heights. Which of the following types of correlation is shown on the scatter plot?
A. Positive
B. Positive and negative
C. Negative
D. No correlation
Answer Explanation
correlations fall into positive, negative, and no correlation. A positive correlation shows that an increase in one variable increase results in an increase on the other variable increases as shown.
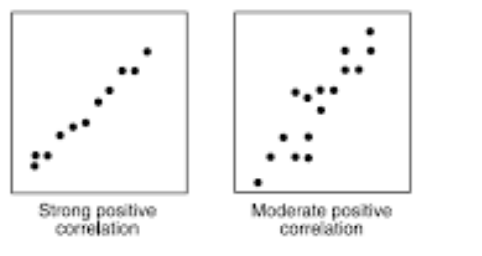
A negative correlation scatter plot shows that an increase in one variable results in a decrease on the other one.
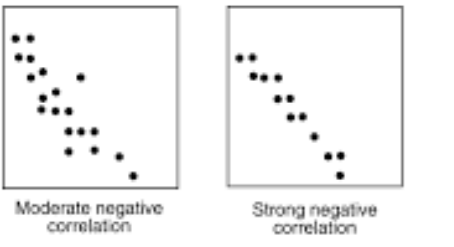
The no-correlation scatter plot demonstrates that there is no response between variables. A change in one variable has no effect on the other variable.
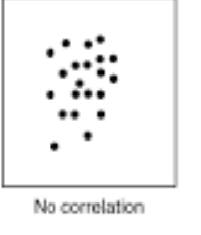
Looking at the provided scatter plot, the heights of the students does not have any relationship on the students’ scores. Thus, the type of correlation is no correlation.
-
Q #2: A sweater that normally sells for $78 is marked 15% off. Which of the following estimates the sale price of the sweater?
A. $12
B. $66
C. $22
D. $69
Answer Explanation
we are to find the selling price of the sweater from the marked price and the discount. The marked price is given as
Discount=mark off rate*original price
Discount=15%*$78
Convert 15% into a fraction, which become 15/100=0.15. Then
Discount=0.15*$78=$11.70
The selling price of the sweater will be the original price less the discount or mark off value. Then,

Thus, the approximate selling price of the sweater is $66.
-
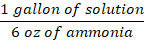
Q #3: One gallon of cleaning solution requires 6 oz of ammonia. If the maintenance department needs 230 gallons of solution to clean all of the floors, how much ammonia is needed?
A. 1380 gallons
B. 6900 gallons
C. 1380 oz
D. 1400 oz
Answer Explanation
from the given data, one gallon of cleaning solution requires 6 oz of ammonia. The mathematical expression of this statement can be expressed in two ways:
Or
The question requires we find the amount of ammonia needed to make 230 gallons of the solution. So, we use the second option and proceed as follows:

From the above equation, gallon of solution will cancel, and oz of ammonia is left.
Therefore, the solution will require 1380 oz of ammonia.

