The scatter plot below shows the relationship between the number of hours a student listens to music and the student’s test scores. Which of the following types of correlation is shown on the scatter plot?
A. Positive
B. Positive and negative
C. No correlation
D. Negative
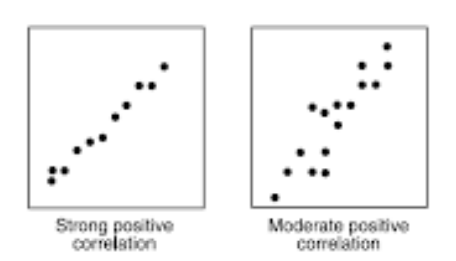
scatter plots can of three types: positive, negative and no correlation. A positive correlation scatter plot shows that as one variable increase, the other variable increases. A positive correlation can be visually depicted below.
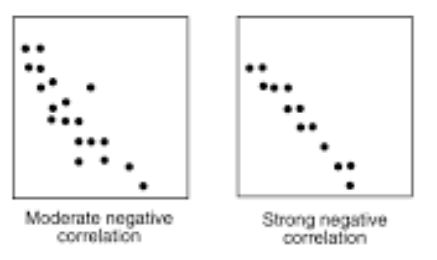
In a negative correlation, the change in one variable is inversely proportional to another variable. That is, as one variable increases, the other variable decreases as shown below.
The third type of scatter plot is a no-correlation scatter plot. In this type of plot, there is no defined relationship between one variable and another one as in the curve below.
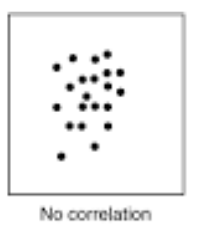
If we look at the relationship between the time the student listens to music and his test score, it is evident that no relationship exists between the two variables. Thus, this is a type of no correlation scatter plot.
Therefore, the Correct Answer is C.
More Questions on TEAS 7 Math
-
Q #1: 2(4x+3)=7x+5 Solve the equation above for x. Which of the following is correct?
A. 1
B. 2
C. -1
D. 11
Answer Explanation
we follow the order operations to solve for the unknown value of x.
2(4x+3)=7x+5
Open the bracket on the LHS by multiplying each term by 2
(2*4x)+(2*3)=7x+5
8x+6=7x+5
Subtract 6 from both sides
8x+6-6=7x+5-6
8x=7x-1
Subtract 7x on both sides
8x-7x=7x-7x-1
X=-1
Thus, the value of unknown value of x is -1.
-
Q #2: A sweater that normally sells for $87 is marked 25% off. Which of the following estimates the sale price of the sweater?
A. $51
B. $36
C. $22
D. $65
Answer Explanation
: we are to find the selling price of the sweater after subtracting the mark off price.
Mark off value=mark off rate*original price
Mark of value=25%*$87
We convert 25% into a fraction, which become 25/100=0.25. Then
Mark of value=0.25*$87=$21.75
The selling price of the sweater will be the original price less the mark off value. Then,

Thus, the approximate selling price of the sweater is $65.
-
Q #3: As a person cycling increases speed, the rate of calories burned, distance traveled, and energy expended also increase. Which of the following is the independent variable?
A. Energy
B. Calories
C. Speed
D. Distance
Answer Explanation
an independent variable is one that when changed, causes the other variable(s) to change. In our case, calories burned, distance traveled, energy used increase when cycling speed increases.
Therefore, speed is the independent variable while other variables are dependent.

