A teacher has asked all the students in the class which days of the week they get up after 8 a.m. which of the following is the best way to display the frequency for each day of the week?
A. Histogram
B. Pie graph
C. Scatter plot
D. Bar graph
The best way to display the frequency of each day of the week when students get up after 8 a.m. is by using a bar graph. Bar graphs are well-suited for representing categorical data, where each day of the week is a separate category, and the height of each bar corresponds to the count or frequency of students waking up late on that specific day.
Note: Histograms, on the other hand, are more appropriate for visualizing continuous or numerical data and are not ideal for categorical data like days of the week. Histograms are useful for understanding the distribution of data, identifying patterns, and assessing the shape of the data distribution, such as whether it's normally distributed, skewed, or has multiple modes.
As you can see below, the Histogram is used to depict a pattern/continuous/range data. While a bar graph does just fine even with discrete data.


Therefore, the Correct Answer is D.
More Questions on TEAS 7 Math
-
Q #1: Which of the following is the median of the date set below? 5, -3, 10, -2, 0
A. 5
B. 2
C. 10
D. 0
Answer Explanation
To find the median, we arrange the following numbers in data set from the smallest to the largest as follows.
-3, -2, 0, 5, 10
From the above the data set, the median falls in the third position. Thus, 0 is the median for the given data set.
-
Q #2: A baker is using a cookie recipe that call for 2 ¼ cups of flour to yield 36 cookies. How much flour will the baker need to make 90 cookies using the same recipe?
A. 6 ¾ cups
B. 5 5/8 cups
C. 10 1/8 cups
D. 4 ¾ cups
Answer Explanation
We are asked to find the number of cups of flour that will be used to make 90 cookies.
Letting x be the number of cups of flour and setting the proportion equation with number of cookies on numerator and number of cups of flour on the denominator. We have
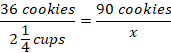
Solve the value of x by cross-multiplying
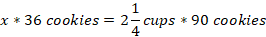
We convert the mixed fraction into improper fraction in order to carry out multiplication
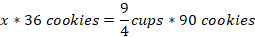
\(x =\ \frac{9}{4}\ cups\ *\ 90\ cookies\ *\ \frac{1}{36}\ cookies\)
The number of cups of flour needed to make 90 cookies is 5.625 cups, which is equal to 5 5/8 cups(Choice B).
-
Q #3: There are 800 students enrolled in four allied health program at a local community college. The percent students in each program is displayed in the pie chart. Which of the following is the number of students enrolled in the respiratory care program?
A. 168
B. 144
C. 336
D. 152
Answer Explanation
We are asked to find the number of students enrolled in the respiratory care program using the percentages in the pie chart.
If we let x represent the number of students enrolled in the respiratory care program, we can set a proportion equation with number of students on the numerator and percentages on the denominator. The whole pie chart represents 100%, which is 800 students. Then, 19% will represent
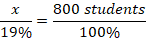
We solve the value of x by cross-multiplying the equation above.
So, 152 students will enroll for a respiratory care program.

