/

A teacher earns $730.00 per week before any tax deductions. The following taxes are deducted each week: $72.00 federal income tax, $35.00 state income tax, and $65.00 Social Security tax. How much will the teacher make in 4 weeks after taxes are deducted?

A. $2,250.00

B. $2,550.00

C. $2,400.00

D. $2,232.00

Answer Explanation:

The net income is the salary of the teacher gets after deducting total taxes.

Weekly net income=weekly gross income-total tax

Total tax=federal income tax+state income tax+Social Security tax

Total tax=$(72.00+35.00+65.00)

Total tax=$172.00

Weekly net income=$(730.00-172.00)=$558.00

The net income the teacher gets in 4 weeks is what she gets in one week multiplied by 4


The teacher will earn a net income of $2,232.00 in 4 weeks after taxes are deducted.

Therefore, the Correct Answer is D.

More Questions on TEAS 7 Math

  • Q #1: An athlete runs 5 miles in 25 minutes and then changes their pace to run the next 3 miles in 15 minutes. Overall, what is the average time in minutes it takes the athlete to run 1 mile?

    A. 7 minutes

    B. 5 minutes

    C. 6.5 minutes

    D. 8.5 minutes

    Answer Explanation

    to find the average time the athlete runs in 1 mile, find total time divided by total distance covered in the two runs.

    Total distance=5+3=8 miles

    Total time=25+15=40 minutes

    We now know that the athlete runs 8 miles in 40 minutes, so the time the athlete will run in 1 mile will be:  


    In 5 minutes, the athlete runs 1 mile.

  • Q #2: How may milliliters are there in 3.2 liters?  

    A. 0.32

    B. 32

    C. 3200

    D. 320

    Answer Explanation

    We know that 1 L =1000 mL, which we use to convert between the two units. The conversion fractions of interconverting are:

    And

    Since we want to end up with millimeters, the second conversion is used in converting L to mL as:

    Thus, 3.2 L is equivalent to 3200 mL.

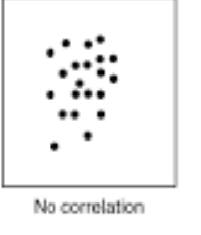
  • Q #3: The scatter plot below shows the relationship between the student’s exam scores and the students’ heights. Which of the following types of correlation is shown on the scatter plot?

    A. Positive

    B. Positive and negative

    C. Negative

    D. No correlation

    Answer Explanation

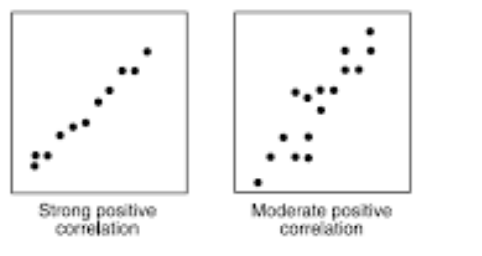
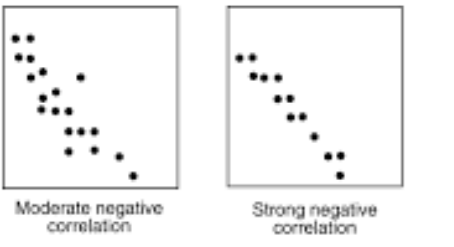
    correlations fall into positive, negative, and no correlation.  A positive correlation shows that an increase in one variable increase results in an increase on the other variable increases as shown.

    A negative correlation scatter plot shows that an increase in one variable results in a decrease on the other one.

    The no-correlation scatter plot demonstrates that there is no response between variables. A change in one variable has no effect on the other variable.


    Looking at the provided scatter plot, the heights of the students does not have any relationship on the students’ scores. Thus, the type of correlation is no correlation.